
CORPORATE FINANCE PORTFOLIO
A portfolio is a grouping of financial assets such as stocks, bonds and cash equivalents, as well as their mutual fund, exchange-traded fund and closed-fund counterparts. Portfolios are held directly by investors or managed by financial professionals. Investors should construct an investment portfolio in accordance with their risk tolerance and investing objectives. Think of an investment portfolio as a pie that is divided into pieces of varying sizes representing different asset classes and/or types of investments to accomplish an appropriate risk-return portfolio allocation.
A conservative investor might favor a portfolio with large cap value stocks, broad-based market index funds, investment-grade bonds and a position in liquid, high-grade cash equivalents. In contrast, a risk-loving investor might add some small cap growth stocks to an aggressive, large cap growth stock position, assume some high-yield bond exposure, and look to real estate, international and alternative investment opportunities for his or her portfolio.
A common way to evaluate portfolio returns is to compare them to a benchmark, such as an index. These are the most common benchmarks:
Portfolio weight is the percentage composition of a particular holding in a portfolio. Portfolio weights can be calculated using different approaches; the most basic type of weight is determined by dividing the dollar value of a security by the total dollar value of the portfolio. Another approach is to divide the number of units of a given security by the total number of shares held in the portfolio.
Portfolio weights are not necessarily applied only to specific securities; investors can calculate the weights of their portfolios in terms of sector, geographical region, index exposure, short and long positions, type of security (such as bonds or small cap technology companies) or any other type of category. Essentially, portfolio weights are determined based on the particular investment strategy.
The Portfolio Management Process
The portfolio management process is the method an investor uses to aid him in meeting his investment goals.
The procedure is as follows:
A policy statement is the statement that contains the investor's goals and constraints as it relates to his investments. This step could be considered to be the most important of all the steps in the portfolio management process. The statement requires the investor to consider his true financial needs, both in the short run and the long run. It helps to guide the investment portfolio manager in meeting the investor's needs. When there is market uncertainty or the investor's needs change, the policy statement will help to guide the investor in making the necessary adjustments to the portfolio in a disciplined manner.
Expressing Investment Objectives in Terms of Risk and Return
Return objectives are important to determine. They help to focus an investor on meeting his financial goals and objectives. However, risk must be considered as well. An investor may require a high rate of return, which is typically accompanied by a higher risk. Despite the need for a high return, an investor may be uncomfortable with the risk that is attached to that higher-return portfolio. As such, it is important to consider not only return but also the investor's risk tolerance in a policy statement.
Factors Affecting Risk Tolerance
Many factors can affect an investor's risk tolerance:
Return objectives can be divided into the following categories:
Investment Constraints
When creating a policy statement, it is important to consider an investor's constraints. There are five types of constraints that need to be considered when creating a policy statement:
Asset allocation is the process of dividing a portfolio among major asset categories such as bonds, stocks and cash. The purpose of asset allocation is to reduce risk by diversifying the portfolio.
The ideal asset allocation differs based on the risk tolerance of the investor. For example, a young executive might have an asset allocation of 80% equity, 20% fixed income, while a retiree would be more likely to have 80% in fixed income and 20% in equities.
Citizens in other countries around the world would have different asset allocation strategies depending on the types and risks of securities available for placement in their portfolios. For example, a retiree located in the United States would most likely have a large portion of his portfolio allocated to U.S. treasuries, since the U.S. government is considered to have an extremely low risk of default. On the other hand, a retiree in a country with political unrest would most likely have a large portion of their portfolio allocated to foreign treasury securities.
Portfolio Management Theories
Risk Aversion
Risk aversion is an investor's general desire to avoid risky investments. Investors typically wish to maximize their returns with the least amount of risk possible. When faced with two investment opportunities with similar returns, a good investor will always choose the investment with the least risk as there is no benefit to choosing a higher level of risk unless there is also an increased level of potential return.
Markowitz Portfolio Theory
Harry Markowitz developed this portfolio model. This model includes not only expected return, but also the level of risk for a particular return. Markowitz assumed the following about an individual's investment behavior:
Markowitz's work on an individual's investment behavior is important not only when looking at individual investment, but also in the context of a portfolio. The risk of a portfolio takes into account each investment's risk and return as well as the investment's correlation with the other investments in the portfolio.
courtesy:http://www.investopedia.com/walkthrough/corporate-finance/4/return-risk/portfolios.aspx
FINANCIAL STATEMENT ANALYSIS
The process of reviewing and evaluating a company's financial statements (such as the balance sheet or profit and loss statement), thereby gaining an understanding of the financial health of the company and enabling more effective decision making. Financial statements record financial data; however, this information must be evaluated through financial statement analysis to become more useful to investors, shareholders, managers and other interested parties.
Financial statement analysis is an evaluative method of determining the past, current and projected performance of a company. Several techniques are commonly used as part of financial statement analysis including horizontal analysis, which compares two or more years of financial data in both dollar and percentage form; vertical analysis, where each category of accounts on the balance sheet is shown as a percentage of the total account; and ratio analysis, which calculates statistical relationships between data.
courtesy:http://www.investopedia.com/terms/f/financial-statement-analysis.asp
LIQUIDITY
'LIQUIDITY'
The degree to which an asset or security can be bought or sold in the market without affecting the asset's price. Liquidity is characterized by a high level of trading activity. Assets that can be easily bought or sold are known as liquid assets.
2. The ability to convert an asset to cash quickly. Also known as "marketability."
There is no specific liquidity formula; however, liquidity is often calculated by using liquidity ratios.
LIQUIDITY:
1. It is safer to invest in liquid assets than illiquid ones because it is easier for an investor to get his/her money out of the investment.
2. Examples of assets that are easily converted into cash include blue chip and money market securities.
courtesy:http://www.investopedia.com/terms/l/liquidity.asp
DEBT/ EQUITY RATIO
The debt to equity ratio identifies companies that are highly leveraged and therefore a higher risk for investors. Find out how this ratio is calculated and how you can use it to evaluate a stock.
A measure of a company's financial leverage calculated by dividing its total liabilities by stockholders' equity. It indicates what proportion of equity and debt the company is using to finance its assets.
A high debt/equity ratio generally means that a company has been aggressive in financing its growth with debt. This can result in volatile earnings as a result of the additional interest expense.
If a lot of debt is used to finance increased operations (high debt to equity), the company could potentially generate more earnings than it would have without this outside financing. If this were to increase earnings by a greater amount than the debt cost (interest), then the shareholders benefit as more earnings are being spread among the same amount of shareholders. However, the cost of this debt financing may outweigh the return that the company generates on the debt through investment and business activities and become too much for the company to handle. This can lead to bankruptcy, which would leave shareholders with nothing.
The debt/equity ratio also depends on the industry in which the company operates. For example, capital-intensive industries such as auto manufacturing tend to have a debt/equity ratio above 2, while personal computer companies have a debt/equity of under 0.5.
FINANCIAL LEVERAGE
Financial leverage is the degree to which a company uses fixed-income securities such as debt and preferred equity. The more debt financing a company uses, the higher its financial leverage. A high degree of financial leverage means high interest payments, which negatively affect the company's bottom-line earnings per share.
Financial risk is the risk to the stockholders that is caused by an increase in debt and preferred equities in a company's capital structure. As a company increases debt and preferred equities, interest payments increase, reducing EPS. As a result, risk to stockholder return is increased. A company should keep its optimal capital structure in mind when making financing decisions to ensure any increases in debt and preferred equity increase the value of the company.
Degree of Financial Leverage
The formula for calculating a company's degree of financial leverage (DFL) measures the percentage change in earnings per share over the percentage change in EBIT. DFL is the measure of the sensitivity of EPS to changes in EBIT as a result of changes in debt.
Formula:
DFL = percentage change in EPS or EBIT
percentage change in EBIT EBIT-interest
A shortcut to keep in mind with DFL is that if interest is 0, then the DLF will be equal to 1.
Example: Degree of Financial Leverage
With Newco's current production, its sales are $7 million annually. The company's variable costs of sales are 40% of sales, and its fixed costs are $2.4 million. The company's annual interest expense is $100,000. If we increase Newco's EBIT by 20%, how much will the company's EPS increase?
Calculation and Answer:
The company's DFL is calculated as follows:
DFL = ($7,000,000-$2,800,000-$2,400,000)/($7,000,000-$2,800,000-$2,400,000-$100,000)
DFL = $1,800,000/$1,700,000 = 1.058
Given the company's 20% increase in EB
EARNINGS MANAGEMENT
Earnings management is the process by which management can potentially manipulate the financial statements to represent what they wish to have happened during the period rather than what actually happened. Reasons why management may want to manage earnings include both internal and external pressures. Perhaps the most important section of this chapter is that of dealing with the common techniques used to manage earnings. It is through a thorough understanding of these methods that earnings management can be spotted. These strategies are important to know as an accountant, auditor, financial analyst, creditor, or investor. Healthy skepticism on the part of these various interests, and contributors, to the financial statements will further detection, and a reduction, of earnings management practices. By improving the quality of the information in financial statements, through better accounting standards and ethical behavior, the cost of doing business decreases. Not only is this true with the cost of capital, as the chapter describes, but nowhere is it more clearly seen today than with the additional costs publicly traded companies are now faced with to come into compliance with the provisions of the Sarbanes-Oxley Act. Earnings management and unethical behavior of the past is costing businesses more today.
Tips, Hints, and Things to Remember
Identify the factors that motivate earnings management. How? How will you be able to remember these factors? The first thing to recall is that there are internal and external reasons. The main internal reason is to meet targets. The targets may be there for a number of reasons. Some may just be budgeted numbers, which if they are not met will look unfavorable on the person, department, or company that “blew the budget.” Others may be “required” numbers, which if not met will mean that a person doesn’t get his or her bonus. The external factors are a bit more diverse. The company may have previously projected numbers that external parties are now expecting the company to meet or exceed. External analysts may have made their own predictions public, which the company would now like to achieve. Investors, and potential investors, like to see continual upward income growth. It looks really positive and looks as if the company is doing well in the charts found in annual reports. Hence, income smoothing is the second external factor potentially contributing to earnings management. Finally, if a company is looking for new financing, they will have an easier time obtaining it (or obtain better terms if it is debt financing) if they have good looking financial statements. Therefore, window dressing is the final factor listed.
If you like mnemonic devices for remembering things, then WISE is the word to remember for the factors motivating earnings management.
1. Window Dressing
2. Internal Targets
3. Income Smoothing
4. External Expectations
Common techniques used to manage earnings.
How? There is a spectrum of degrees to which a company can manage earnings. Some could hardly be called serious or unethical, while the other end of the continuum includes both illegal and fraudulant accounting activity.
The continuum can be seen in Exhibit 6-4, which lays out the degrees in terms of seriousness from left to right with the more permissable techniques shown the further you move to the left. How? How are companies still able to manage earnings given the concerns raised by former SEC Chairman Arthur Levitt? Part of the answer is that they aren’t able to do so as easily as before. As the chapter mentions, the FASB and the SEC have issued further rules and guidelines since Levitt’s comments that have reduced the amount of accounting “hocus pocus” that can be accomplished. However, the other part of the answer is that accrual accounting is not purely objective. Estimates and judgement calls are still required in many situations. Let’s look at each of Levitt’s top five in a bit more detail.
1. The big bath – This form of income manipulation can be thought of as part of income smoothing. What it usually does is effectively accelerate expenses and losses into a single year with already poor results so that future income looks better and smoother. Even though the FASB has issued fairly recent statements to reduce the magnitude for taking a big bath, companies can, and do, still use this technique. Examples may include recognizing losses on assets that have a fair market value below the current book, or carrying, value, cookie jar reserves (to be discussed in 3. below); and doing a restructuring (taking the expenses allowed under SFAS No. 146) that a company may not otherwise have done.
2. Creative acquisition accounting – As the number of acquisitions has decreased (since the late 1990s) and with the advent of SFAS Nos. 141 and 142, this doesn’t seem to be as much of a problem as it once was. Still, when a company has made an acquisition or acquisitions during the year, the transactions should be looked at closely to see exactly how they were accounted for and what effect the treatment has on current, and will have on future, earnings.
3. Cookie jar reserves – These can go along with the big bath and are a form of income smoothing. Earnings are managed under this method by selecting the period in which a revenue or expense item is taken. This is usually done for expenses that are based on estimates. If a company is having a particularly good year and next year’s results are uncertain, they can over-accrue some reserves in the current year and then have the ability to under-accrue them in the next year if needed. By doing so, they effectively inflate the following year’s income at the expense of this year’s. Income, thus, appears smoother, and the company may be able to publicly forecast higher profits for the following year even if their business isn’t actually going to do any better in the following year. This may temporarily be good for the stock price, but it isn’t good for those wanting to know how the company is actually performing. 6-4 Chapter 6
4. Materiality – This topic may not be a big deal to small companies since nearly everything is material and, hence, should be accounted for. But for large, publicly traded companies with revenues and assets in the billions of dollars, they can potentially get away with millions of dollars worth of misstatements and merely write them off as being “nonmaterial” in nature. Auditors are primarily concerned with material misstatements. Materiality has the potential to allow companies to slightly fudge their numbers, just enough to get them to where the analysts forecasted.
5. Revenue recognition – Sort of the flip-side of cookie jar reserves, improper revenue (or expense) recognition can lead to inflated financial statements now at the expense of future earnings. Some companies that have dabbled with this earnings management technique then have to inflate revenue in the next period even more to make up for the shortfall caused by the prior period’s accelaration of revenue. It becomes a never-ending game of covering up for the previously improperly recorded revenue and can fairly easily lead to outright fraud. Several of the bigger scandals of the past few years have been the result of companies improperly, and/or prematurely, recording revenues in order to meet or exceed forecasts, only to have the house of cards eventually come tumbling down, resulting in massive restatements to the prior financial statements, new management, new auditors, and very low stock prices (if not bankruptcy).
courtesy:http://www.cengage.com/resource_uploads/downloads/032459237X_174365.pdf
STANDARDIZED FINANCIAL STATEMENT
Business finance is always concerned with the financial stability of a company. With regards to this concern, financial statements are tools of managers and analysts to determine the stability and opportunities of the company to venture in the long-run of business world. Hence, financial statements also determine how well opportunities for investments are offered and paid off for and by the company and investors.
Investors of the company look at financial statements and compare these with other company's financial statement to weigh which greater opportunity and security are offered for them to invest their money. It's almost impossible to directly compare the financial statements for two companies because of differences in size and currency if lives in different locations. (Ross, et. al., 2007)
From this problem, standardized financial statement is a useful way to start making comparisons. Standardizing financial statements implies using of percentages instead of a currency or amount. The resulting financial statements are called Common-size statements.
A Common-size statement is a standardized financial statement presenting all items in a percentage terms. Balance sheet items are shown as a percentage of sales.
In a common-size balanced sheet, assets are expressed in a percentage over the total assets; liabilities and accounts under equity are expressed in percentage over the total liabilities and owner's equity. From these, I we can examine how strong the growth of company in looking up to the proportions of its financial statements.
Standardizing the income statement implies expressing each item as a percentage of total sales. Hence, it shows us cost percentages of each item as part of sales. Moreover, it determines the following:
· How much cost of each one peso in sales goes to pay for an item?
· How much was the percentage and each peso flows through the firm's net income.
· How much for each peso in sales was spitted to be retained and finally to be paid out in dividends.
Example of a Common-size of Balanced Sheet
A portfolio is a grouping of financial assets such as stocks, bonds and cash equivalents, as well as their mutual fund, exchange-traded fund and closed-fund counterparts. Portfolios are held directly by investors or managed by financial professionals. Investors should construct an investment portfolio in accordance with their risk tolerance and investing objectives. Think of an investment portfolio as a pie that is divided into pieces of varying sizes representing different asset classes and/or types of investments to accomplish an appropriate risk-return portfolio allocation.
A conservative investor might favor a portfolio with large cap value stocks, broad-based market index funds, investment-grade bonds and a position in liquid, high-grade cash equivalents. In contrast, a risk-loving investor might add some small cap growth stocks to an aggressive, large cap growth stock position, assume some high-yield bond exposure, and look to real estate, international and alternative investment opportunities for his or her portfolio.
A common way to evaluate portfolio returns is to compare them to a benchmark, such as an index. These are the most common benchmarks:
- Standard & Poor's 500 - for large-cap stocks
- Russell 2000 - for small-cap stocks
- Europe, Australia and Far East Index (EAFE) - for international stocks
Portfolio weight is the percentage composition of a particular holding in a portfolio. Portfolio weights can be calculated using different approaches; the most basic type of weight is determined by dividing the dollar value of a security by the total dollar value of the portfolio. Another approach is to divide the number of units of a given security by the total number of shares held in the portfolio.
Portfolio weights are not necessarily applied only to specific securities; investors can calculate the weights of their portfolios in terms of sector, geographical region, index exposure, short and long positions, type of security (such as bonds or small cap technology companies) or any other type of category. Essentially, portfolio weights are determined based on the particular investment strategy.
The Portfolio Management Process
The portfolio management process is the method an investor uses to aid him in meeting his investment goals.
The procedure is as follows:
- Create a Policy Statement – A policy statement is the statement that contains the investor's goals and constraints as they relate to his investments.
- Develop an Investment Strategy – This entails creating a strategy that combines the investor's goals and objectives with current financial market and economic conditions.
- Implement the Plan Created – This entails putting the investment strategy to work by investing in a portfolio that meets the client's goals and constraint requirements.
- Monitor and Update the Plan – Both markets and investors' needs change as time passes. As such, it is important to monitor for these changes as they occur and to update the plan to adjust accordingly.
A policy statement is the statement that contains the investor's goals and constraints as it relates to his investments. This step could be considered to be the most important of all the steps in the portfolio management process. The statement requires the investor to consider his true financial needs, both in the short run and the long run. It helps to guide the investment portfolio manager in meeting the investor's needs. When there is market uncertainty or the investor's needs change, the policy statement will help to guide the investor in making the necessary adjustments to the portfolio in a disciplined manner.
Expressing Investment Objectives in Terms of Risk and Return
Return objectives are important to determine. They help to focus an investor on meeting his financial goals and objectives. However, risk must be considered as well. An investor may require a high rate of return, which is typically accompanied by a higher risk. Despite the need for a high return, an investor may be uncomfortable with the risk that is attached to that higher-return portfolio. As such, it is important to consider not only return but also the investor's risk tolerance in a policy statement.
Factors Affecting Risk Tolerance
Many factors can affect an investor's risk tolerance:
- Age – An investor may have lower risk tolerance as they get older and financial constraints are more prevalent.
- Family situation – An investor may have higher income needs if they are supporting a child in college or an elderly relative.
- Wealth and income – An investor may have a greater ability to invest in a portfolio if he or she has existing wealth or high income.
- Psychological – An investor may simply have a lower tolerance for risk based on his personality.
Return objectives can be divided into the following categories:
- Capital Preservation - Capital preservation is the need to maintain capital. To accomplish this objective, the return objective should, at a minimum, be equal to the inflation rate. In other words, the nominal rate of return would equal the inflation rate. With this objective, an investor simply wants to preserve his existing capital.
- Capital Appreciation - Capital appreciation is the need to grow, rather than simply preserve, capital. To accomplish this objective, the return objective should be equal to a return that exceeds the expected inflation rate. With this objective, an investor's intention is to grow his existing capital base.
- Current Income - Current income is the need to create income from the investor's capital base. This objective is common among retired investors who no longer have income from work and therefore need to generate income from their investments to meet living expenses and other spending needs.
- Total Return - Total return is the need to grow the capital base through both capital appreciation and reinvestment of that appreciation.
Investment Constraints
When creating a policy statement, it is important to consider an investor's constraints. There are five types of constraints that need to be considered when creating a policy statement:
- Liquidity Constraints - Liquidity constraints identify an investor's need for liquidity (or cash). For example, within the next year, an investor needs $50,000 for the purchase of a new home. The $50,000 would be considered a liquidity constraint because it needs to be set aside (be liquid) for the investor.
- Time Horizon - A time horizon constraint develops a timeline of an investor's various financial needs. The time horizon also affects an investor's ability to accept risk. If an investor has a long time horizon, the investor may have a greater ability to accept risk because he would have a longer time period to recoup any losses. This is unlike an investor with a shorter time horizon, such as an investor nearing retirement, whose ability to accept risk may be lower because he would not have the ability to recoup any losses.
- Tax Concerns - After-tax returns are the returns investors are focused on when creating an investment portfolio. If an investor is currently in a high tax bracket as a result of her income, it may be important to focus on investing more heavily in tax-deferred investments.
- Legal and Regulatory - Legal and regulatory factors can act as an investment constraint and must be considered. An example of this would occur in a trust. A trust could require that no more than 10% of the trust be distributed each year. Legal and regulatory constraints such as this one often can't be changed and must not be overlooked.
- Unique Circumstances - Any special needs or constraints not recognized in any of the constraints listed above would fall in this category. An example of a unique circumstance would be the constraint an investor might place on investing in any company they do not consider socially responsible, such as a tobacco company.
Asset allocation is the process of dividing a portfolio among major asset categories such as bonds, stocks and cash. The purpose of asset allocation is to reduce risk by diversifying the portfolio.
The ideal asset allocation differs based on the risk tolerance of the investor. For example, a young executive might have an asset allocation of 80% equity, 20% fixed income, while a retiree would be more likely to have 80% in fixed income and 20% in equities.
Citizens in other countries around the world would have different asset allocation strategies depending on the types and risks of securities available for placement in their portfolios. For example, a retiree located in the United States would most likely have a large portion of his portfolio allocated to U.S. treasuries, since the U.S. government is considered to have an extremely low risk of default. On the other hand, a retiree in a country with political unrest would most likely have a large portion of their portfolio allocated to foreign treasury securities.
Portfolio Management Theories
Risk Aversion
Risk aversion is an investor's general desire to avoid risky investments. Investors typically wish to maximize their returns with the least amount of risk possible. When faced with two investment opportunities with similar returns, a good investor will always choose the investment with the least risk as there is no benefit to choosing a higher level of risk unless there is also an increased level of potential return.
Markowitz Portfolio Theory
Harry Markowitz developed this portfolio model. This model includes not only expected return, but also the level of risk for a particular return. Markowitz assumed the following about an individual's investment behavior:
- Given the same level of expected return, an investor will choose the investment with the lowest amount of risk.
- Investors measure risk in terms of an investment's variance or standard deviation.
- For each investment, the investor can quantify the investment's expected return and the probability of those returns over a specified time horizon.
- Investors seek to maximize their utility.
- Investors make decisions based on an investment's risk and return, therefore, an investor's utility curve is based on risk and return.
Markowitz's work on an individual's investment behavior is important not only when looking at individual investment, but also in the context of a portfolio. The risk of a portfolio takes into account each investment's risk and return as well as the investment's correlation with the other investments in the portfolio.
courtesy:http://www.investopedia.com/walkthrough/corporate-finance/4/return-risk/portfolios.aspx
FINANCIAL STATEMENT ANALYSIS
The process of reviewing and evaluating a company's financial statements (such as the balance sheet or profit and loss statement), thereby gaining an understanding of the financial health of the company and enabling more effective decision making. Financial statements record financial data; however, this information must be evaluated through financial statement analysis to become more useful to investors, shareholders, managers and other interested parties.
Financial statement analysis is an evaluative method of determining the past, current and projected performance of a company. Several techniques are commonly used as part of financial statement analysis including horizontal analysis, which compares two or more years of financial data in both dollar and percentage form; vertical analysis, where each category of accounts on the balance sheet is shown as a percentage of the total account; and ratio analysis, which calculates statistical relationships between data.
courtesy:http://www.investopedia.com/terms/f/financial-statement-analysis.asp
LIQUIDITY
'LIQUIDITY'
The degree to which an asset or security can be bought or sold in the market without affecting the asset's price. Liquidity is characterized by a high level of trading activity. Assets that can be easily bought or sold are known as liquid assets.
2. The ability to convert an asset to cash quickly. Also known as "marketability."
There is no specific liquidity formula; however, liquidity is often calculated by using liquidity ratios.
LIQUIDITY:
1. It is safer to invest in liquid assets than illiquid ones because it is easier for an investor to get his/her money out of the investment.
2. Examples of assets that are easily converted into cash include blue chip and money market securities.
courtesy:http://www.investopedia.com/terms/l/liquidity.asp
DEBT/ EQUITY RATIO
The debt to equity ratio identifies companies that are highly leveraged and therefore a higher risk for investors. Find out how this ratio is calculated and how you can use it to evaluate a stock.
A measure of a company's financial leverage calculated by dividing its total liabilities by stockholders' equity. It indicates what proportion of equity and debt the company is using to finance its assets.
A high debt/equity ratio generally means that a company has been aggressive in financing its growth with debt. This can result in volatile earnings as a result of the additional interest expense.
If a lot of debt is used to finance increased operations (high debt to equity), the company could potentially generate more earnings than it would have without this outside financing. If this were to increase earnings by a greater amount than the debt cost (interest), then the shareholders benefit as more earnings are being spread among the same amount of shareholders. However, the cost of this debt financing may outweigh the return that the company generates on the debt through investment and business activities and become too much for the company to handle. This can lead to bankruptcy, which would leave shareholders with nothing.
The debt/equity ratio also depends on the industry in which the company operates. For example, capital-intensive industries such as auto manufacturing tend to have a debt/equity ratio above 2, while personal computer companies have a debt/equity of under 0.5.
FINANCIAL LEVERAGE
Financial leverage is the degree to which a company uses fixed-income securities such as debt and preferred equity. The more debt financing a company uses, the higher its financial leverage. A high degree of financial leverage means high interest payments, which negatively affect the company's bottom-line earnings per share.
Financial risk is the risk to the stockholders that is caused by an increase in debt and preferred equities in a company's capital structure. As a company increases debt and preferred equities, interest payments increase, reducing EPS. As a result, risk to stockholder return is increased. A company should keep its optimal capital structure in mind when making financing decisions to ensure any increases in debt and preferred equity increase the value of the company.
Degree of Financial Leverage
The formula for calculating a company's degree of financial leverage (DFL) measures the percentage change in earnings per share over the percentage change in EBIT. DFL is the measure of the sensitivity of EPS to changes in EBIT as a result of changes in debt.
Formula:
DFL = percentage change in EPS or EBIT
percentage change in EBIT EBIT-interest
A shortcut to keep in mind with DFL is that if interest is 0, then the DLF will be equal to 1.
Example: Degree of Financial Leverage
With Newco's current production, its sales are $7 million annually. The company's variable costs of sales are 40% of sales, and its fixed costs are $2.4 million. The company's annual interest expense is $100,000. If we increase Newco's EBIT by 20%, how much will the company's EPS increase?
Calculation and Answer:
The company's DFL is calculated as follows:
DFL = ($7,000,000-$2,800,000-$2,400,000)/($7,000,000-$2,800,000-$2,400,000-$100,000)
DFL = $1,800,000/$1,700,000 = 1.058
Given the company's 20% increase in EB
EARNINGS MANAGEMENT
Earnings management is the process by which management can potentially manipulate the financial statements to represent what they wish to have happened during the period rather than what actually happened. Reasons why management may want to manage earnings include both internal and external pressures. Perhaps the most important section of this chapter is that of dealing with the common techniques used to manage earnings. It is through a thorough understanding of these methods that earnings management can be spotted. These strategies are important to know as an accountant, auditor, financial analyst, creditor, or investor. Healthy skepticism on the part of these various interests, and contributors, to the financial statements will further detection, and a reduction, of earnings management practices. By improving the quality of the information in financial statements, through better accounting standards and ethical behavior, the cost of doing business decreases. Not only is this true with the cost of capital, as the chapter describes, but nowhere is it more clearly seen today than with the additional costs publicly traded companies are now faced with to come into compliance with the provisions of the Sarbanes-Oxley Act. Earnings management and unethical behavior of the past is costing businesses more today.
Tips, Hints, and Things to Remember
Identify the factors that motivate earnings management. How? How will you be able to remember these factors? The first thing to recall is that there are internal and external reasons. The main internal reason is to meet targets. The targets may be there for a number of reasons. Some may just be budgeted numbers, which if they are not met will look unfavorable on the person, department, or company that “blew the budget.” Others may be “required” numbers, which if not met will mean that a person doesn’t get his or her bonus. The external factors are a bit more diverse. The company may have previously projected numbers that external parties are now expecting the company to meet or exceed. External analysts may have made their own predictions public, which the company would now like to achieve. Investors, and potential investors, like to see continual upward income growth. It looks really positive and looks as if the company is doing well in the charts found in annual reports. Hence, income smoothing is the second external factor potentially contributing to earnings management. Finally, if a company is looking for new financing, they will have an easier time obtaining it (or obtain better terms if it is debt financing) if they have good looking financial statements. Therefore, window dressing is the final factor listed.
If you like mnemonic devices for remembering things, then WISE is the word to remember for the factors motivating earnings management.
1. Window Dressing
2. Internal Targets
3. Income Smoothing
4. External Expectations
Common techniques used to manage earnings.
How? There is a spectrum of degrees to which a company can manage earnings. Some could hardly be called serious or unethical, while the other end of the continuum includes both illegal and fraudulant accounting activity.
The continuum can be seen in Exhibit 6-4, which lays out the degrees in terms of seriousness from left to right with the more permissable techniques shown the further you move to the left. How? How are companies still able to manage earnings given the concerns raised by former SEC Chairman Arthur Levitt? Part of the answer is that they aren’t able to do so as easily as before. As the chapter mentions, the FASB and the SEC have issued further rules and guidelines since Levitt’s comments that have reduced the amount of accounting “hocus pocus” that can be accomplished. However, the other part of the answer is that accrual accounting is not purely objective. Estimates and judgement calls are still required in many situations. Let’s look at each of Levitt’s top five in a bit more detail.
1. The big bath – This form of income manipulation can be thought of as part of income smoothing. What it usually does is effectively accelerate expenses and losses into a single year with already poor results so that future income looks better and smoother. Even though the FASB has issued fairly recent statements to reduce the magnitude for taking a big bath, companies can, and do, still use this technique. Examples may include recognizing losses on assets that have a fair market value below the current book, or carrying, value, cookie jar reserves (to be discussed in 3. below); and doing a restructuring (taking the expenses allowed under SFAS No. 146) that a company may not otherwise have done.
2. Creative acquisition accounting – As the number of acquisitions has decreased (since the late 1990s) and with the advent of SFAS Nos. 141 and 142, this doesn’t seem to be as much of a problem as it once was. Still, when a company has made an acquisition or acquisitions during the year, the transactions should be looked at closely to see exactly how they were accounted for and what effect the treatment has on current, and will have on future, earnings.
3. Cookie jar reserves – These can go along with the big bath and are a form of income smoothing. Earnings are managed under this method by selecting the period in which a revenue or expense item is taken. This is usually done for expenses that are based on estimates. If a company is having a particularly good year and next year’s results are uncertain, they can over-accrue some reserves in the current year and then have the ability to under-accrue them in the next year if needed. By doing so, they effectively inflate the following year’s income at the expense of this year’s. Income, thus, appears smoother, and the company may be able to publicly forecast higher profits for the following year even if their business isn’t actually going to do any better in the following year. This may temporarily be good for the stock price, but it isn’t good for those wanting to know how the company is actually performing. 6-4 Chapter 6
4. Materiality – This topic may not be a big deal to small companies since nearly everything is material and, hence, should be accounted for. But for large, publicly traded companies with revenues and assets in the billions of dollars, they can potentially get away with millions of dollars worth of misstatements and merely write them off as being “nonmaterial” in nature. Auditors are primarily concerned with material misstatements. Materiality has the potential to allow companies to slightly fudge their numbers, just enough to get them to where the analysts forecasted.
5. Revenue recognition – Sort of the flip-side of cookie jar reserves, improper revenue (or expense) recognition can lead to inflated financial statements now at the expense of future earnings. Some companies that have dabbled with this earnings management technique then have to inflate revenue in the next period even more to make up for the shortfall caused by the prior period’s accelaration of revenue. It becomes a never-ending game of covering up for the previously improperly recorded revenue and can fairly easily lead to outright fraud. Several of the bigger scandals of the past few years have been the result of companies improperly, and/or prematurely, recording revenues in order to meet or exceed forecasts, only to have the house of cards eventually come tumbling down, resulting in massive restatements to the prior financial statements, new management, new auditors, and very low stock prices (if not bankruptcy).
courtesy:http://www.cengage.com/resource_uploads/downloads/032459237X_174365.pdf
STANDARDIZED FINANCIAL STATEMENT
Business finance is always concerned with the financial stability of a company. With regards to this concern, financial statements are tools of managers and analysts to determine the stability and opportunities of the company to venture in the long-run of business world. Hence, financial statements also determine how well opportunities for investments are offered and paid off for and by the company and investors.
Investors of the company look at financial statements and compare these with other company's financial statement to weigh which greater opportunity and security are offered for them to invest their money. It's almost impossible to directly compare the financial statements for two companies because of differences in size and currency if lives in different locations. (Ross, et. al., 2007)
From this problem, standardized financial statement is a useful way to start making comparisons. Standardizing financial statements implies using of percentages instead of a currency or amount. The resulting financial statements are called Common-size statements.
A Common-size statement is a standardized financial statement presenting all items in a percentage terms. Balance sheet items are shown as a percentage of sales.
In a common-size balanced sheet, assets are expressed in a percentage over the total assets; liabilities and accounts under equity are expressed in percentage over the total liabilities and owner's equity. From these, I we can examine how strong the growth of company in looking up to the proportions of its financial statements.
Standardizing the income statement implies expressing each item as a percentage of total sales. Hence, it shows us cost percentages of each item as part of sales. Moreover, it determines the following:
· How much cost of each one peso in sales goes to pay for an item?
· How much was the percentage and each peso flows through the firm's net income.
· How much for each peso in sales was spitted to be retained and finally to be paid out in dividends.
Example of a Common-size of Balanced Sheet
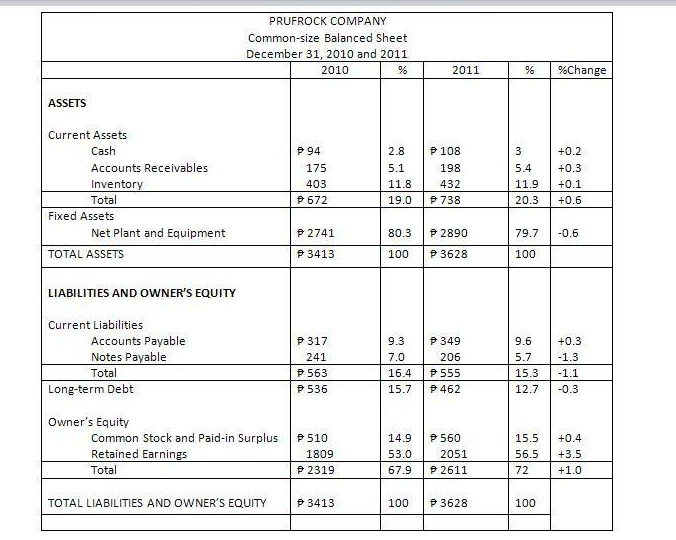
From the standardized balanced sheet, we can examine the growth of a company's current and fixed assets over its total assets, and liabilities and equity over the company's total liabilities and equity.
Example of a common-size income statement
Example of a common-size income statement
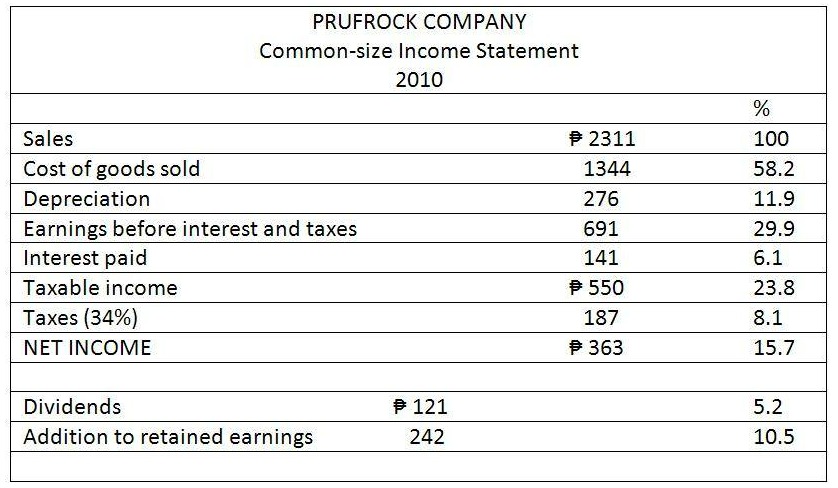
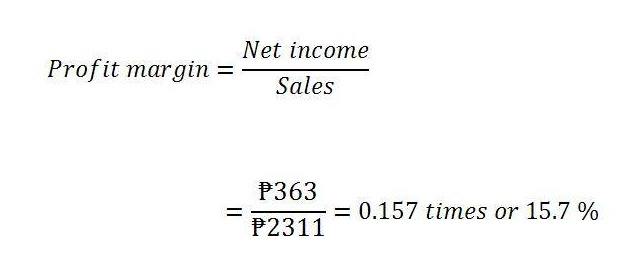
This income statement tells us what happens to each peso in sales. For Prufrock, ₱ 0.582 of each sale peso goes to cost of goods sold; interest expense eats up ₱ 0.061 out of every sales peso, and; taxes take another ₱ 0.081 peso sales. ₱ 0.157 of each peso flows through net income, and that amount is split into ₱ 0.105 retained in the business and ₱ 0.52 paid out in dividends.
COMMON RATIO ON EVALUATING FINANCIAL STRENGTHS
Financial ratios are a tool for analysis in comparing relationships between different items included in a company's financial information. Financial ratios are grouped into the following categories:
1. Short-term solvency, or liquidity, ratios.
2. Long-term solvency, or financial leverage, ratios.
3. Asset management, or Turn-over, ratios.
4. Profitability ratios.
5. Market value ratios.
SHORT TERM SOLVENCY, OR LIQUIDITY, MEASURES
It is a measure for firm's liquidity and ability to pay its bills over the short-run period. This measure focuses on current assets and liabilities and is interesting to short-run creditors, such as banks and lenders.
Current Ratio.It indicates the liquidity of the firm. Higher current ratios indicates better liquidity of a company. This may indicate an inefficient use of cash and short-term assets. It would not be a bad sign for a company with a large reserve or untapped borrowing power.
Financial ratios are a tool for analysis in comparing relationships between different items included in a company's financial information. Financial ratios are grouped into the following categories:
1. Short-term solvency, or liquidity, ratios.
2. Long-term solvency, or financial leverage, ratios.
3. Asset management, or Turn-over, ratios.
4. Profitability ratios.
5. Market value ratios.
SHORT TERM SOLVENCY, OR LIQUIDITY, MEASURES
It is a measure for firm's liquidity and ability to pay its bills over the short-run period. This measure focuses on current assets and liabilities and is interesting to short-run creditors, such as banks and lenders.
- Current Ratio
- Quick (or Acid-Test) Ratio
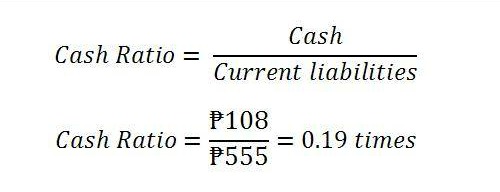
- Cash Ratio
Current Ratio.It indicates the liquidity of the firm. Higher current ratios indicates better liquidity of a company. This may indicate an inefficient use of cash and short-term assets. It would not be a bad sign for a company with a large reserve or untapped borrowing power.
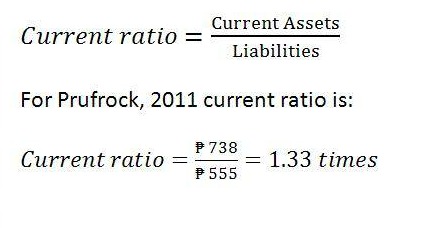
Current ratio is a measure of short-term liquidity because current assets and liabilities are, in principle, converted to cash over the following 12 months. The unit of measurement is either peso or times.
Current ratio is affected by various types of transactions. For example, suppose the firm borrows over the long term to raise money. The short-run effect would be an increase in cash from the issue proceeds and an increase in long-term debt. Current liabilities would not be affected, so the current ratio would rise ₱ 1.33 in current assets for every ₱ 1.00 in current liabilities or Prufrock has its current liabilities covers 1.31 times over.
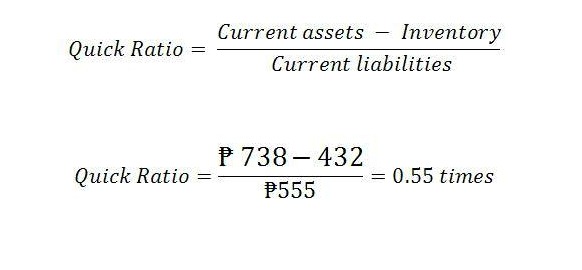
Quick (or Acid-Test) Ratio.It is a measure where inventory is omitted. Inventories are omitted because it is often least liquid or illiquid compared to cash, hence, least reliable measure of market value since quality isn't considered.
Large inventories are sign of short-term trouble, firm may have a substantial portion of its liquidity tied up in slow moving inventory.
Current ratio is affected by various types of transactions. For example, suppose the firm borrows over the long term to raise money. The short-run effect would be an increase in cash from the issue proceeds and an increase in long-term debt. Current liabilities would not be affected, so the current ratio would rise ₱ 1.33 in current assets for every ₱ 1.00 in current liabilities or Prufrock has its current liabilities covers 1.31 times over.
Quick (or Acid-Test) Ratio.It is a measure where inventory is omitted. Inventories are omitted because it is often least liquid or illiquid compared to cash, hence, least reliable measure of market value since quality isn't considered.
Large inventories are sign of short-term trouble, firm may have a substantial portion of its liquidity tied up in slow moving inventory.
Cash Ratio.It is often an interest to use by short-term creditors.
LONG-TERM SOLVENCY MEASURES
This measure addresses long-run capability to meet its obligation or financial leverage.
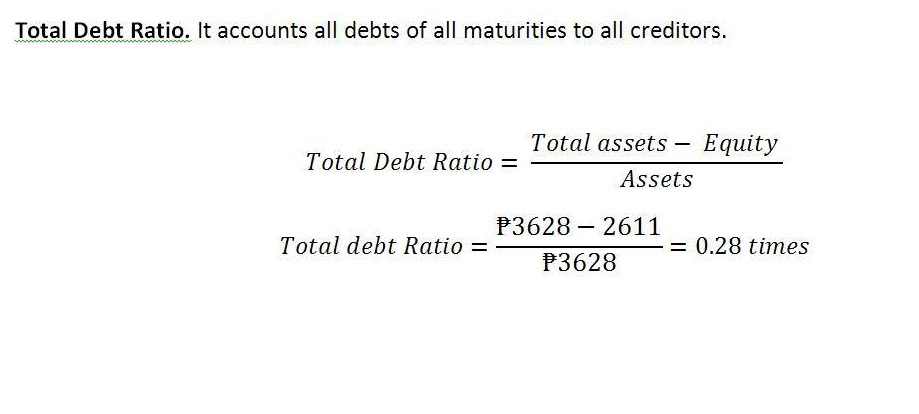
Total Debt Ratio.It accounts all debts of all maturities to all creditors.
This measure addresses long-run capability to meet its obligation or financial leverage.
- Total Debt Ratio
- Times Interest Earned
Total Debt Ratio.It accounts all debts of all maturities to all creditors.
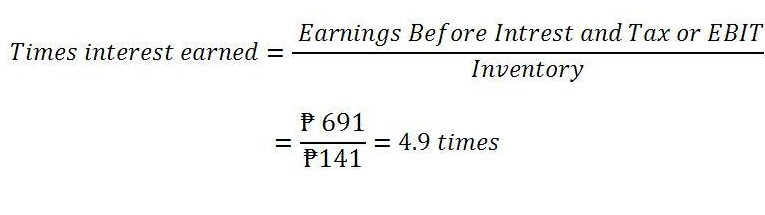
Times Interest Earned. It measures how well a company has its interest obligation covered. It is also known as interest coverage ratio.
Cash Coverage.It basically measures the ability of a firm to generate cash from operations and a measure of cash flow available to meet financial obligations.

ASSET MANAGEMENT, OR TURN-OVER MEASURES
It measures efficiency with which company uses its assets. It is sometimes called Asset Utilization Ratios.
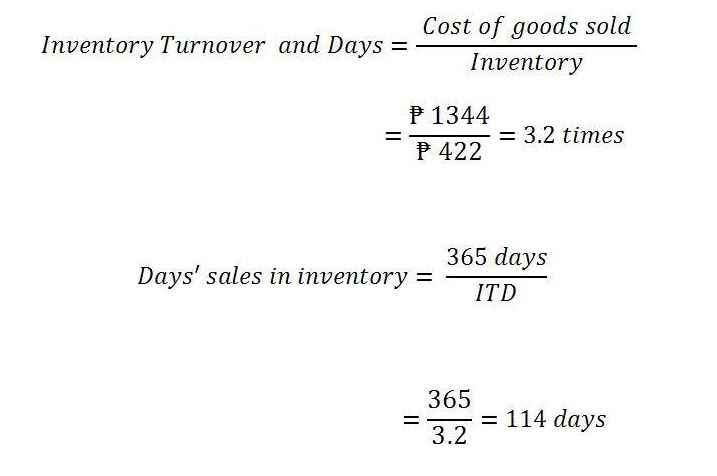
- Inventory Turnover and Days
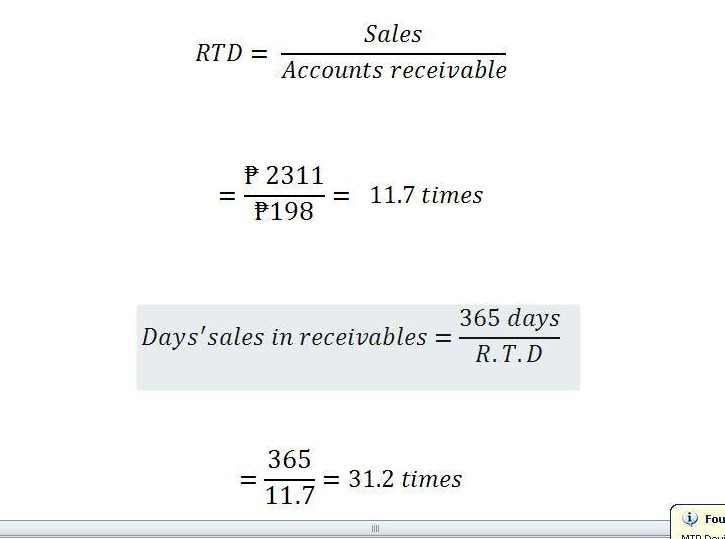
- Receivables Turnover and Days' Sales in Receivables
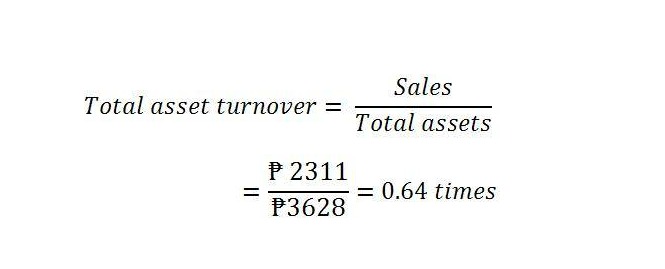
- Total Asset Turnover
Inventory Turnover & Days. It measures how fast a company sell the entire inventory or how long will it took us to turn it over on average before it is sold. It implies that as long as a company we're not running out of stocks and thereby would make a sales, a higher ratio indicates efficiency in managing inventory.
Receivables Turnover and Days' Sales in Receivables. It measures how fast we collect on those sales.
Total Asset Turnover.It is measure of "big picture" ratio of sales.
Profit Margin.Companies pay a great deal of attention to their profit margin. A high profit margin is obviously desirable.
Return on Assets. It is a measure of profit per dollar of assets.

Return on Equity (ROE). ROE measures how the stockholders fared during this year or the performance of a firm which benefits the shareholders. However, it is inappropriate to compare the results to an interest rate observed in the financial market.
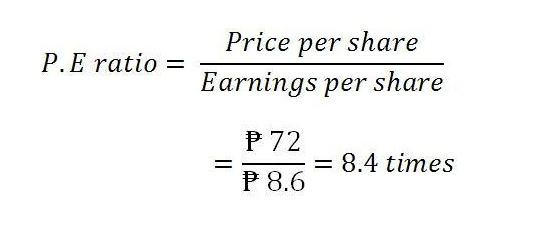
Price Earnings Ratio.It measures how much investors are willing to pay per peso of current earnings. Higher price earnings ratio indicates future growth.
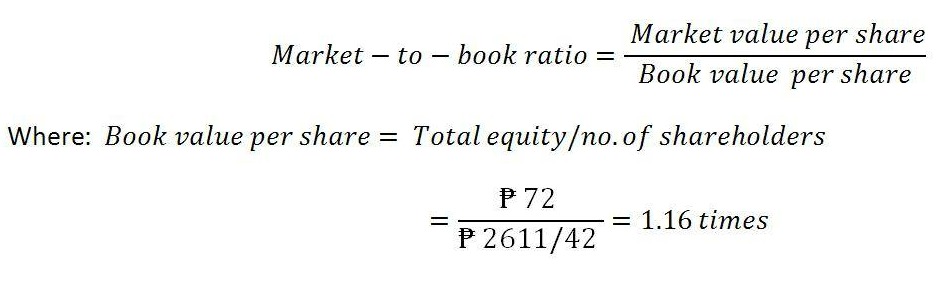
Market-to-Book Ratio.It compares the market value of the firm's investments to their cost. A value less than 1 indicates that the firm has not been successful overall in creating value for its stockholders.
ROA, ROE, and Growth.Investors and others are frequently interested in knowing how rapidly a firm's sales can grow. If sales are to grow, assets have to grow, thus, growth need to be financed. Firm's capability to grow depends on its financing policy as well. Growth rate is a tool for evaluating company's stock.
Two (2) broad sources of financing are:
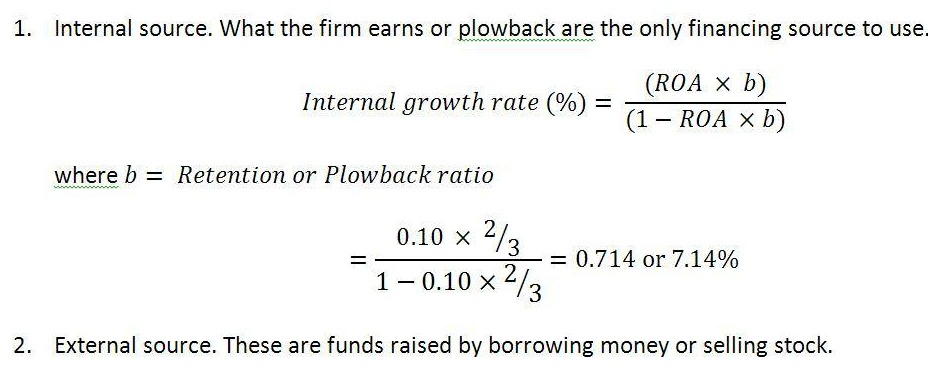
Sustainable growth rate illustrates an explicit relationship between the firm's four (4) major areas of concern :
Why evaluate financial statements?
Internal Uses.It evaluates performance of the firm and management. It is used importantly in making firm's financial plans and projections.
External Uses.Short-term and long-term creditors and potential investors uses the financial information of the firm. Financial information evaluates also suppliers, and suppliers would also use information before deciding to extend credit to us. Credit-rating agencies uses our financial information to evaluate financial health of business and assessing firm's overall creditworthiness. Financial statement information would be essential in planning to acquire a prospective targets and deciding what to offer.
- Operating efficiency which is determined by Profit margin
- Asset use efficiency determined by Total asset turnover
- Financial policy measured by Debt-equity ratio
- Dividend policy measured by Retention or Plowback ratio
Why evaluate financial statements?
Internal Uses.It evaluates performance of the firm and management. It is used importantly in making firm's financial plans and projections.
External Uses.Short-term and long-term creditors and potential investors uses the financial information of the firm. Financial information evaluates also suppliers, and suppliers would also use information before deciding to extend credit to us. Credit-rating agencies uses our financial information to evaluate financial health of business and assessing firm's overall creditworthiness. Financial statement information would be essential in planning to acquire a prospective targets and deciding what to offer.
